How to View Monitor Data on the ECT with Video
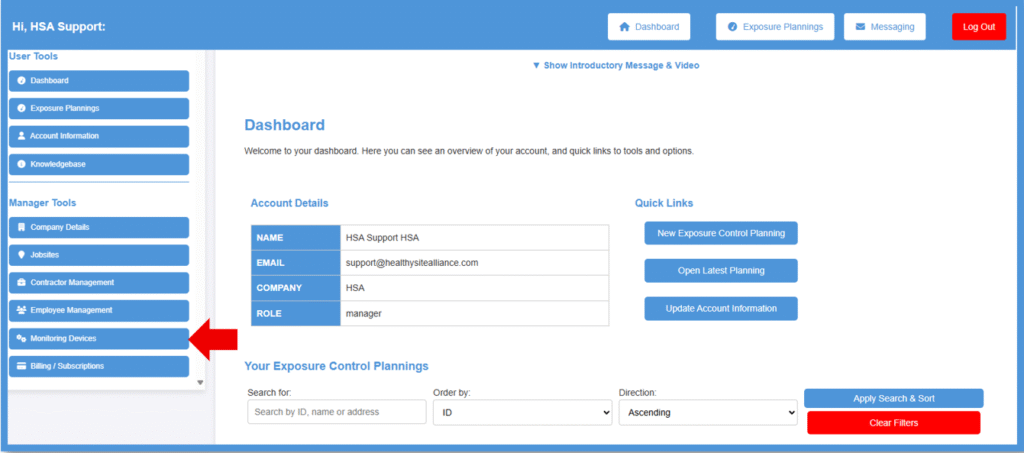
After you have logged into the Exposure Control, click on the ‘Monitoring Devices’ button on the side menu under Manager Tools.
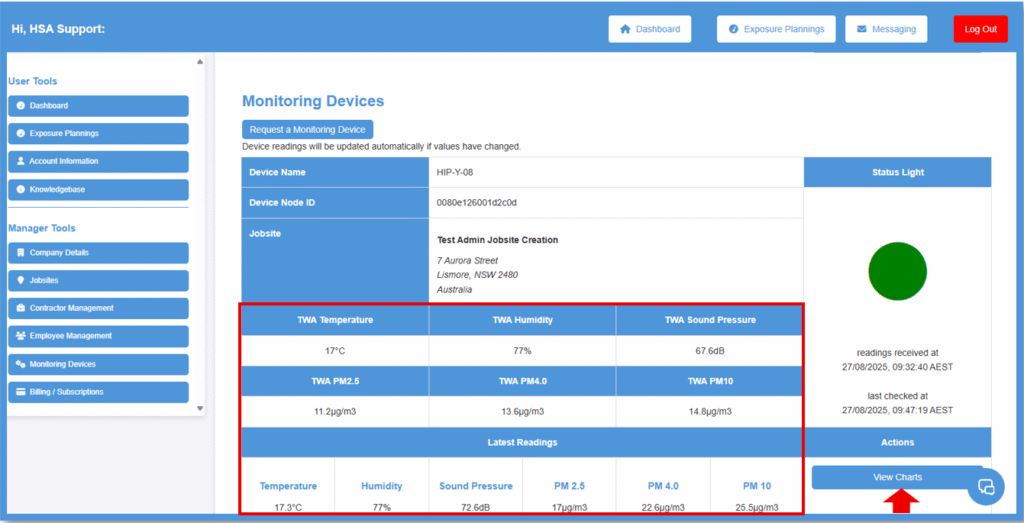
On the Monitoring Devices page, you will see the monitor that is designated to a jobsite you requested.
This page displays the latest readings and TWA.
You will also see a ‘View Charts’ button.
Click on the ‘View Charts’ if you want to see data from a particular time frame.
This page displays all the data reading types in graphs.
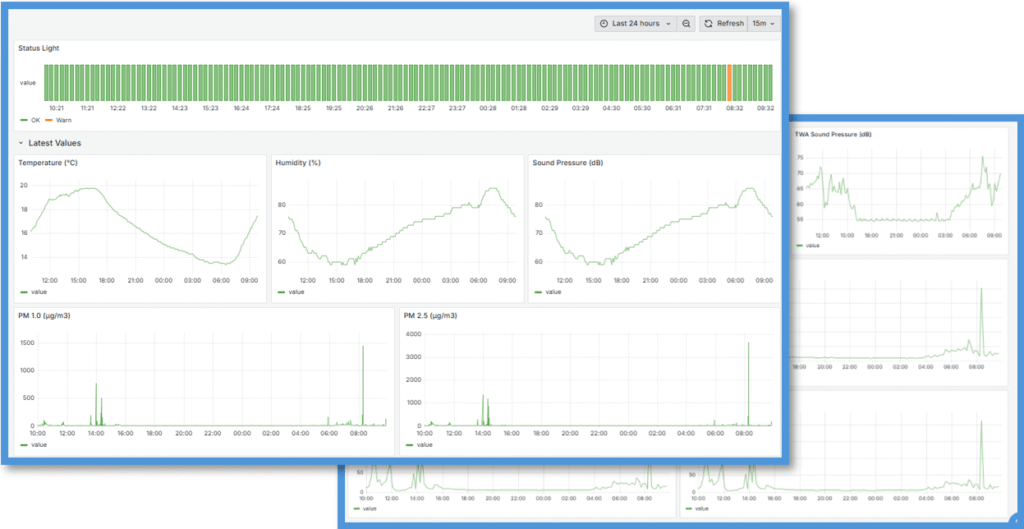
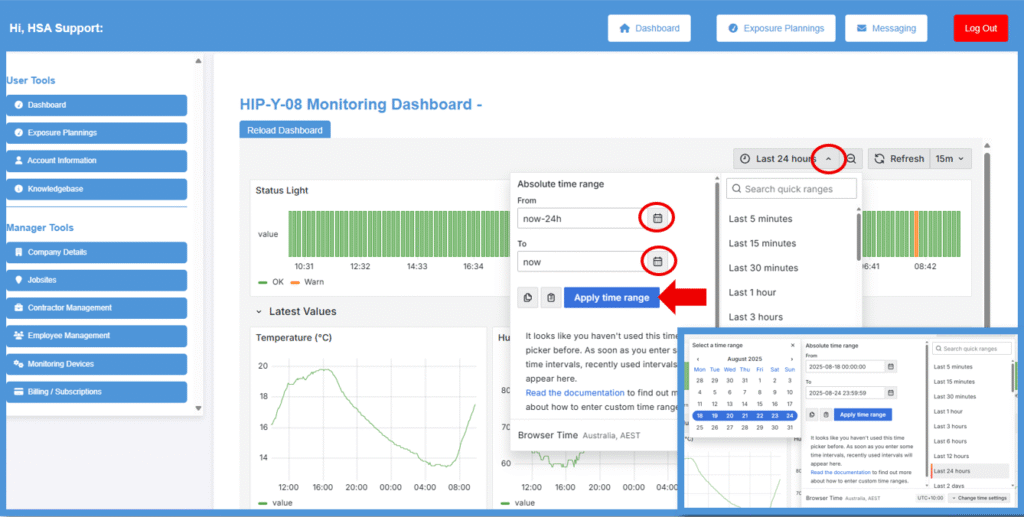
To select a time frame, click on the down arrow at the top right hand side of the screen where it says ‘Last 24 hours’.
Select the ‘From’ date and ‘To’ date by clicking on the calendar icons.
Then click on the ‘Apply Time Range’ button.
You can now see that the time range selected is now showing.
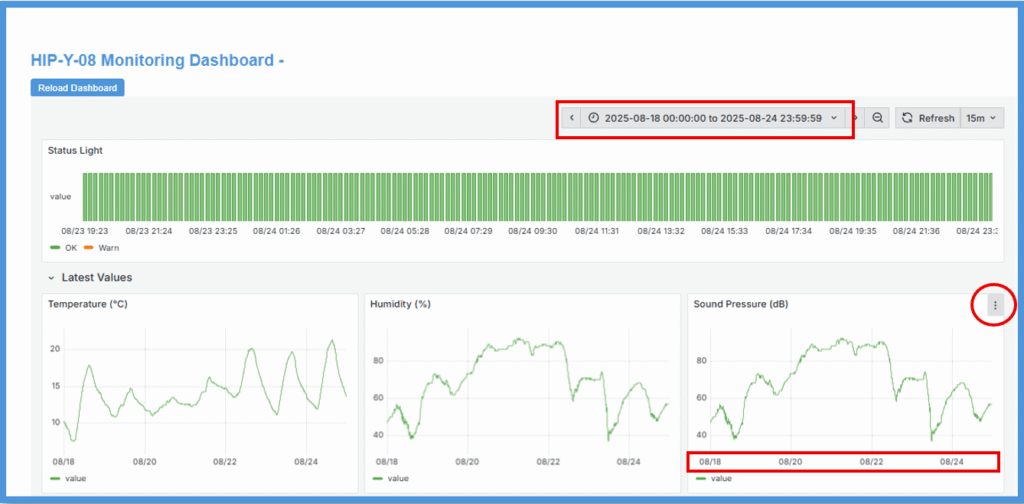
To view the graph larger, click on ‘View’ – This will bring up a full screen of the graph for easy viewing.
Click on the back arrow on your browser to return to the Charts page.
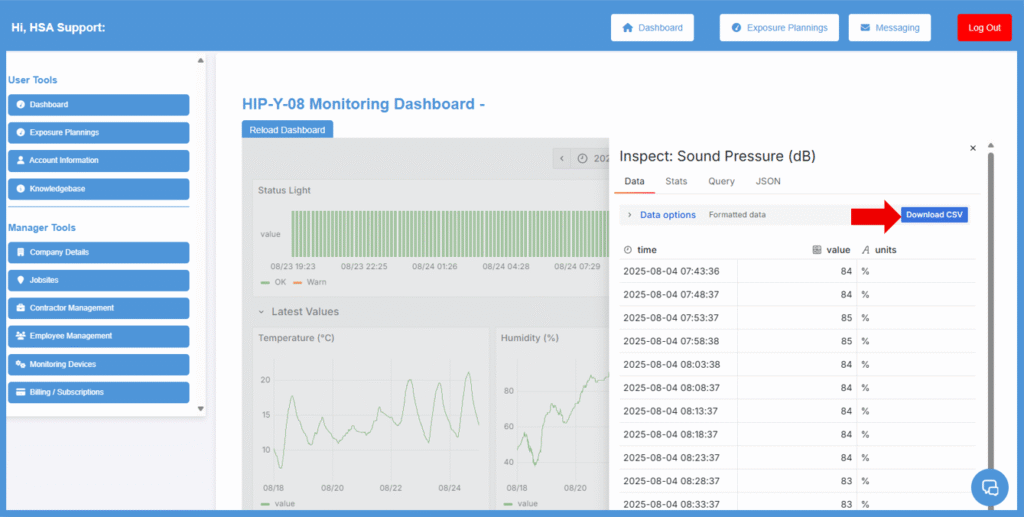
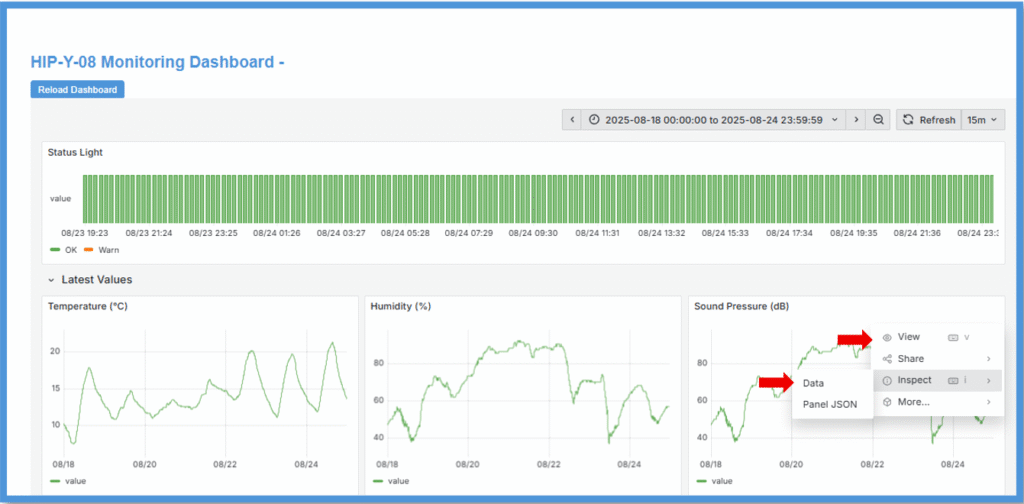
If you want to download the data in a CSV file, hover over inspect and click ‘Data’.

To view the graph larger, click on ‘View’ – This will bring up a full screen of the graph for easy viewing.
Click on the back arrow on your browser to return to the Charts page.
If you want to download the data in a CSV file, hover over inspect and click ‘Data’.
A pop up will appear on the side of your screen.
To download the data in CSV file, click on the ‘Download CSV’ button.
This will download all the data for the time range selected.
